
Median Calculator
Paste or type any list of numbers and the calculator sorts them, finds the median and shows exactly how: the middle value for an odd count, or the average of the two middle values for an even count. It also gives the mean, mode, range, quartiles, interquartile range and any outliers, and a separate mode calculates the median of grouped data from a frequency table.
- Free to use
- No sign-up
- Runs in your browser
Median calculator
Grouped data (optional)
Statistics Basics Worksheets
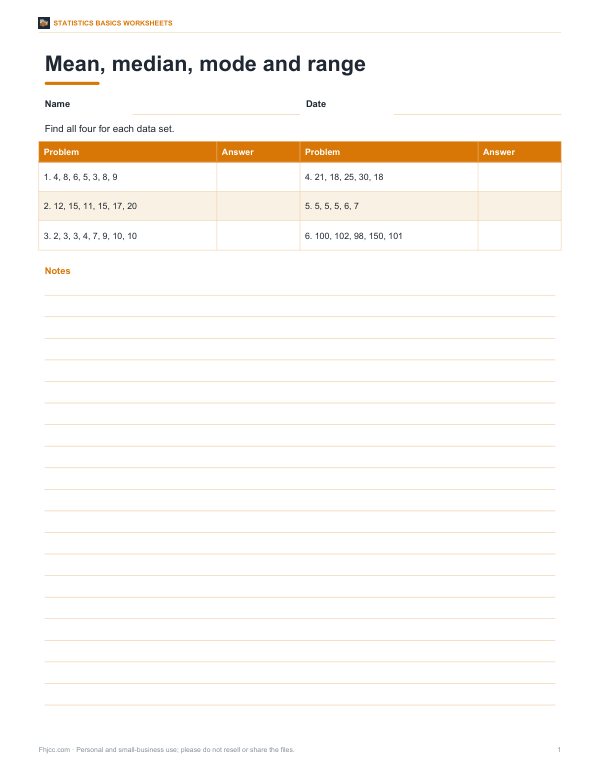
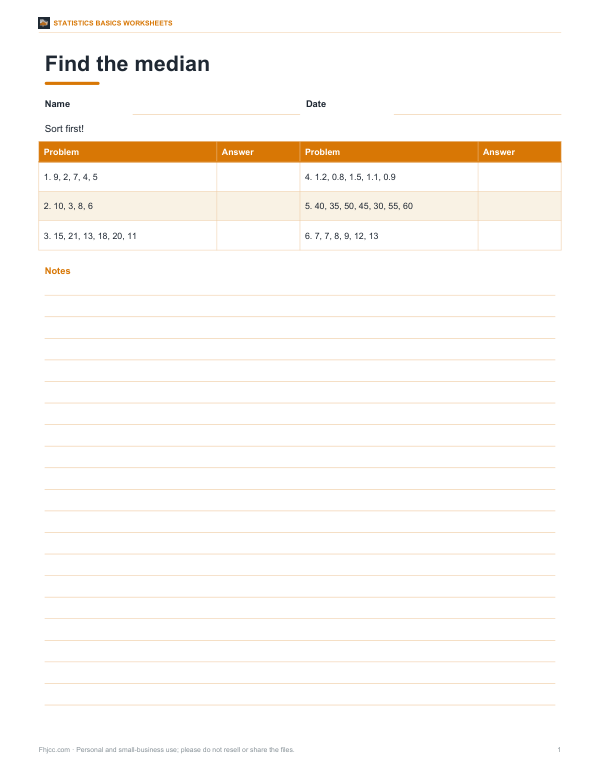
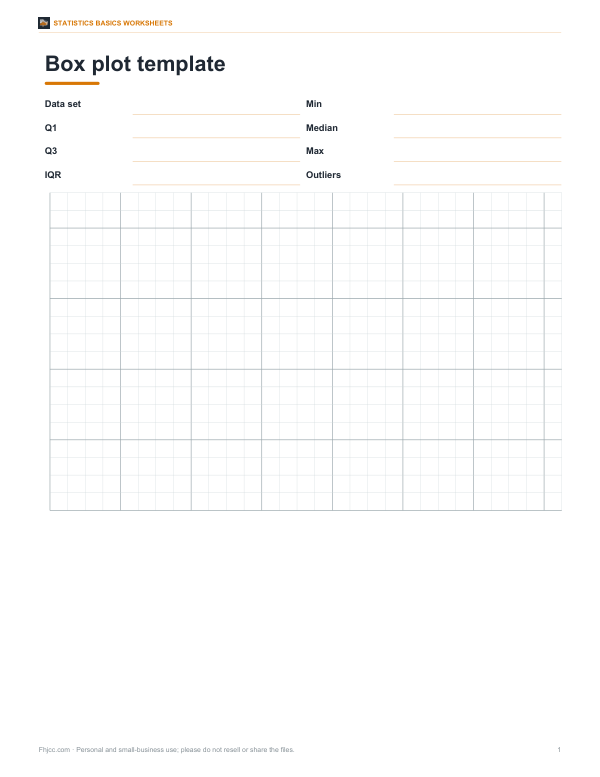
Printable mean, median, mode and range worksheets with answer keys, a box plot template, a grouped data median worksheet and a statistics formula card.
- Averages practice (PDF, DOCX)
- Median practice (PDF, DOCX)
- Box plot template (PDF)
- Formula card (PDF)
Formats: PDF, DOCX. Instant download after payment (link valid 72 hours, up to 5 downloads). AI-assisted: the templates were drafted with AI help and reviewed and laid out before publishing.
$5.00 USD, one-time 4 files · about $1.25 each
- Instant download
- 7-day refund
- Secure checkout by Stripe
7-day money-back guarantee. Full refund within 7 days of purchase, even after you download.
Free sample: Box Plot Template (PDF, 95 KB)
Full refund within 7 days — see the refund policy and license.
Free printables
Single sheets you can print right now, no sign-up. The full pack adds every sheet in one download plus the editable files.
 Printable Statistics Formula Card
What the median is
The median is the middle value of a data set when the values are put in order. Half the values are at or below it and half are at or above it. Unlike the mean (average), the median is not pulled around by a few very large or very small values, which is why it is used for things like house prices and household incomes, where a handful of extreme values would make the average misleading.
How to find the median
- Put the numbers in order from smallest to largest.
- Count how many there are (n).
- If n is odd, the median is the middle value, at position (n + 1) ÷ 2.
- If n is even, the median is the average of the two middle values, at positions n ÷ 2 and n ÷ 2 + 1.
For 3, 7, 9, 12, 15 (n = 5) the median is the 3rd value: 9. For 3, 7, 9, 12, 15, 18 (n = 6) it is the average of the 3rd and 4th values: (9 + 12) ÷ 2 = 10.5.
Median, mean and mode
| Measure | How to find it | Best when |
|---|---|---|
| Median | Middle value of ordered data | Data are skewed or have outliers |
| Mean | Sum ÷ count | Data are roughly symmetric, no extreme values |
| Mode | Most frequent value | Categories or repeated values (shoe sizes, favourite colours) |
In a symmetric distribution the mean and median are close. When the mean is much bigger than the median, a few large values are pulling it up (right skew).
Quartiles and the interquartile range
Quartiles split ordered data into four parts. Q1 is the median of the lower half, Q3 the median of the upper half, and Q2 is the median itself. The interquartile range (IQR = Q3 − Q1) measures the spread of the middle 50% of the data and ignores extremes. Values below Q1 − 1.5 × IQR or above Q3 + 1.5 × IQR are commonly flagged as outliers — the rule used in box plots.
Why quartile methods differ
There is more than one accepted way to calculate quartiles. Many textbooks take the median of each half of the data (excluding the median when n is odd); spreadsheets such as Excel’s QUARTILE.INC and many calculators interpolate between positions. For some data sets the results differ slightly, so the calculator shows both. Use the method your course or software expects.
Median of grouped data
When data are given in class intervals with frequencies, you cannot see individual values, so the median is estimated. Find the median class — the interval containing the (N/2)th value — then use: median = L + ((N/2 − CF) ÷ f) × h, where L is the lower boundary of the median class, CF the cumulative frequency before it, f its frequency and h its width. For the example frequency table (N = 50), the median class is 20–30 and the median is 20 + ((25 − 17) ÷ 18) × 10 ≈ 24.44.
Worked example
Ten test scores — 12, 7, 3, 18, 9, 7, 21, 15, 4, 11 — sorted are 3, 4, 7, 7, 9, 11, 12, 15, 18, 21. With n = 10 (even) the median is the average of the 5th and 6th values: (9 + 11) ÷ 2 = 10. The mean is 107 ÷ 10 = 10.7, the mode is 7, Q1 = 7 and Q3 = 15 by the median-of-halves method, giving an IQR of 8 and no outliers.
Median in spreadsheets
In Excel, Google Sheets and LibreOffice, =MEDIAN(A1:A20) returns the median of a range, =QUARTILE.INC(range, 1) and =QUARTILE.INC(range, 3) give interpolated quartiles, and =QUARTILE.EXC uses a slightly different method. Blank cells are ignored, but cells containing text or zero are treated differently, so check your data before relying on the result.
Weighted median
Sometimes each value carries a weight — for example survey responses weighted by population. The weighted median is the value at which the cumulative weight first reaches half the total weight. The grouped-data method above is a special case, where each class interval carries a frequency.
Where medians are used
- Median household income and house prices in official statistics.
- Median response times in computing and customer service.
- Median survival times in medical research.
- Class test results where a few very high or low scores would skew the mean.
- Box plots summarising the spread of data.
Privacy
Calculations run in your browser; your data are not stored or uploaded.
Frequently asked questions
How do you find the median of an even set of numbers?
Average the two middle values after sorting.
Is the median the same as the average?
No. The mean is the sum divided by the count; the median is the middle value.
When is the median better than the mean?
When the data are skewed or contain outliers.
Can there be more than one median?
No, but for an even count it is the average of two middle values.
What is the median of grouped data?
An estimate found with L + ((N/2 − CF) ÷ f) × h.
What is the median of 1, 2, 3, 4?
2.5, the average of 2 and 3.
Does the median have to be one of the numbers?
Not when there is an even number of values; it can fall between two values.
What is a five-number summary?
Minimum, Q1, median, Q3 and maximum — the values shown in a box plot.
Can I paste data from a spreadsheet?
Yes, copy a column of cells and paste it; line breaks are treated as separators.
Is my data stored?
No, it runs in your browser.